ARE AUSTRALIAN HOUSE PRICES FALLING?
While much is being made of rising interest rates, they currently sit well below inflation levels. Cash deposits may finally be getting a slightly more positive return, but in real terms, the value of the cash is deteriorating and therefore money in the bank is a negative prospect.
Understand how inflation affects the property market, read the PROPERTY AND INFLATION report here.
REAL ESTATE IS USALLY HELD LONG TERM. SO WE PREFER TO VIEW THE PRICE MOVEMENTS OVER THE PAST 12 MONTHS, (OR IDEALLY 5 YEARS) RATHER THAN TO FOCUS ON THE MONTHLY RESULT.
EXAMPLE:
"HOUSE PRICES FALL AS HOUSE BOOM ENDS- HOUSE PRICES DROP MONTH ON MONTH BY 0.6%"
EVEN IF THIS HAPPENS EVERY MONTH FOR A FULL 12 MONTHS, IF PRICES HAVE RISEN BY SAY 15% OVER THE PREVIOUS 12 MONTHS - HISTORY WILL SHOW THE THE ANNUAL RISE WILL STILL BE +7.8%.
WARREN BUFFET: "Do not take yearly results too seriously. Instead, focus on four or five-year averages.” Yearly averages will not give you much insight into the success of an investment. Instead, comparing data from across a number of years will provide you with a much bigger picture that you can use to make necessary adjustments and continue moving forward.
(OUR CHARTS BELOW REFLECT THE "ALL HOUSES" INDEX UPDATED EACH MONTH OVER THE PREVIOUS 12 MONTH PERIOD, FOR EXAMPLE: JAN to JAN, FEB to FEB ETC - AND ALSO INCLUDE LAST MONTHS RESULTS)
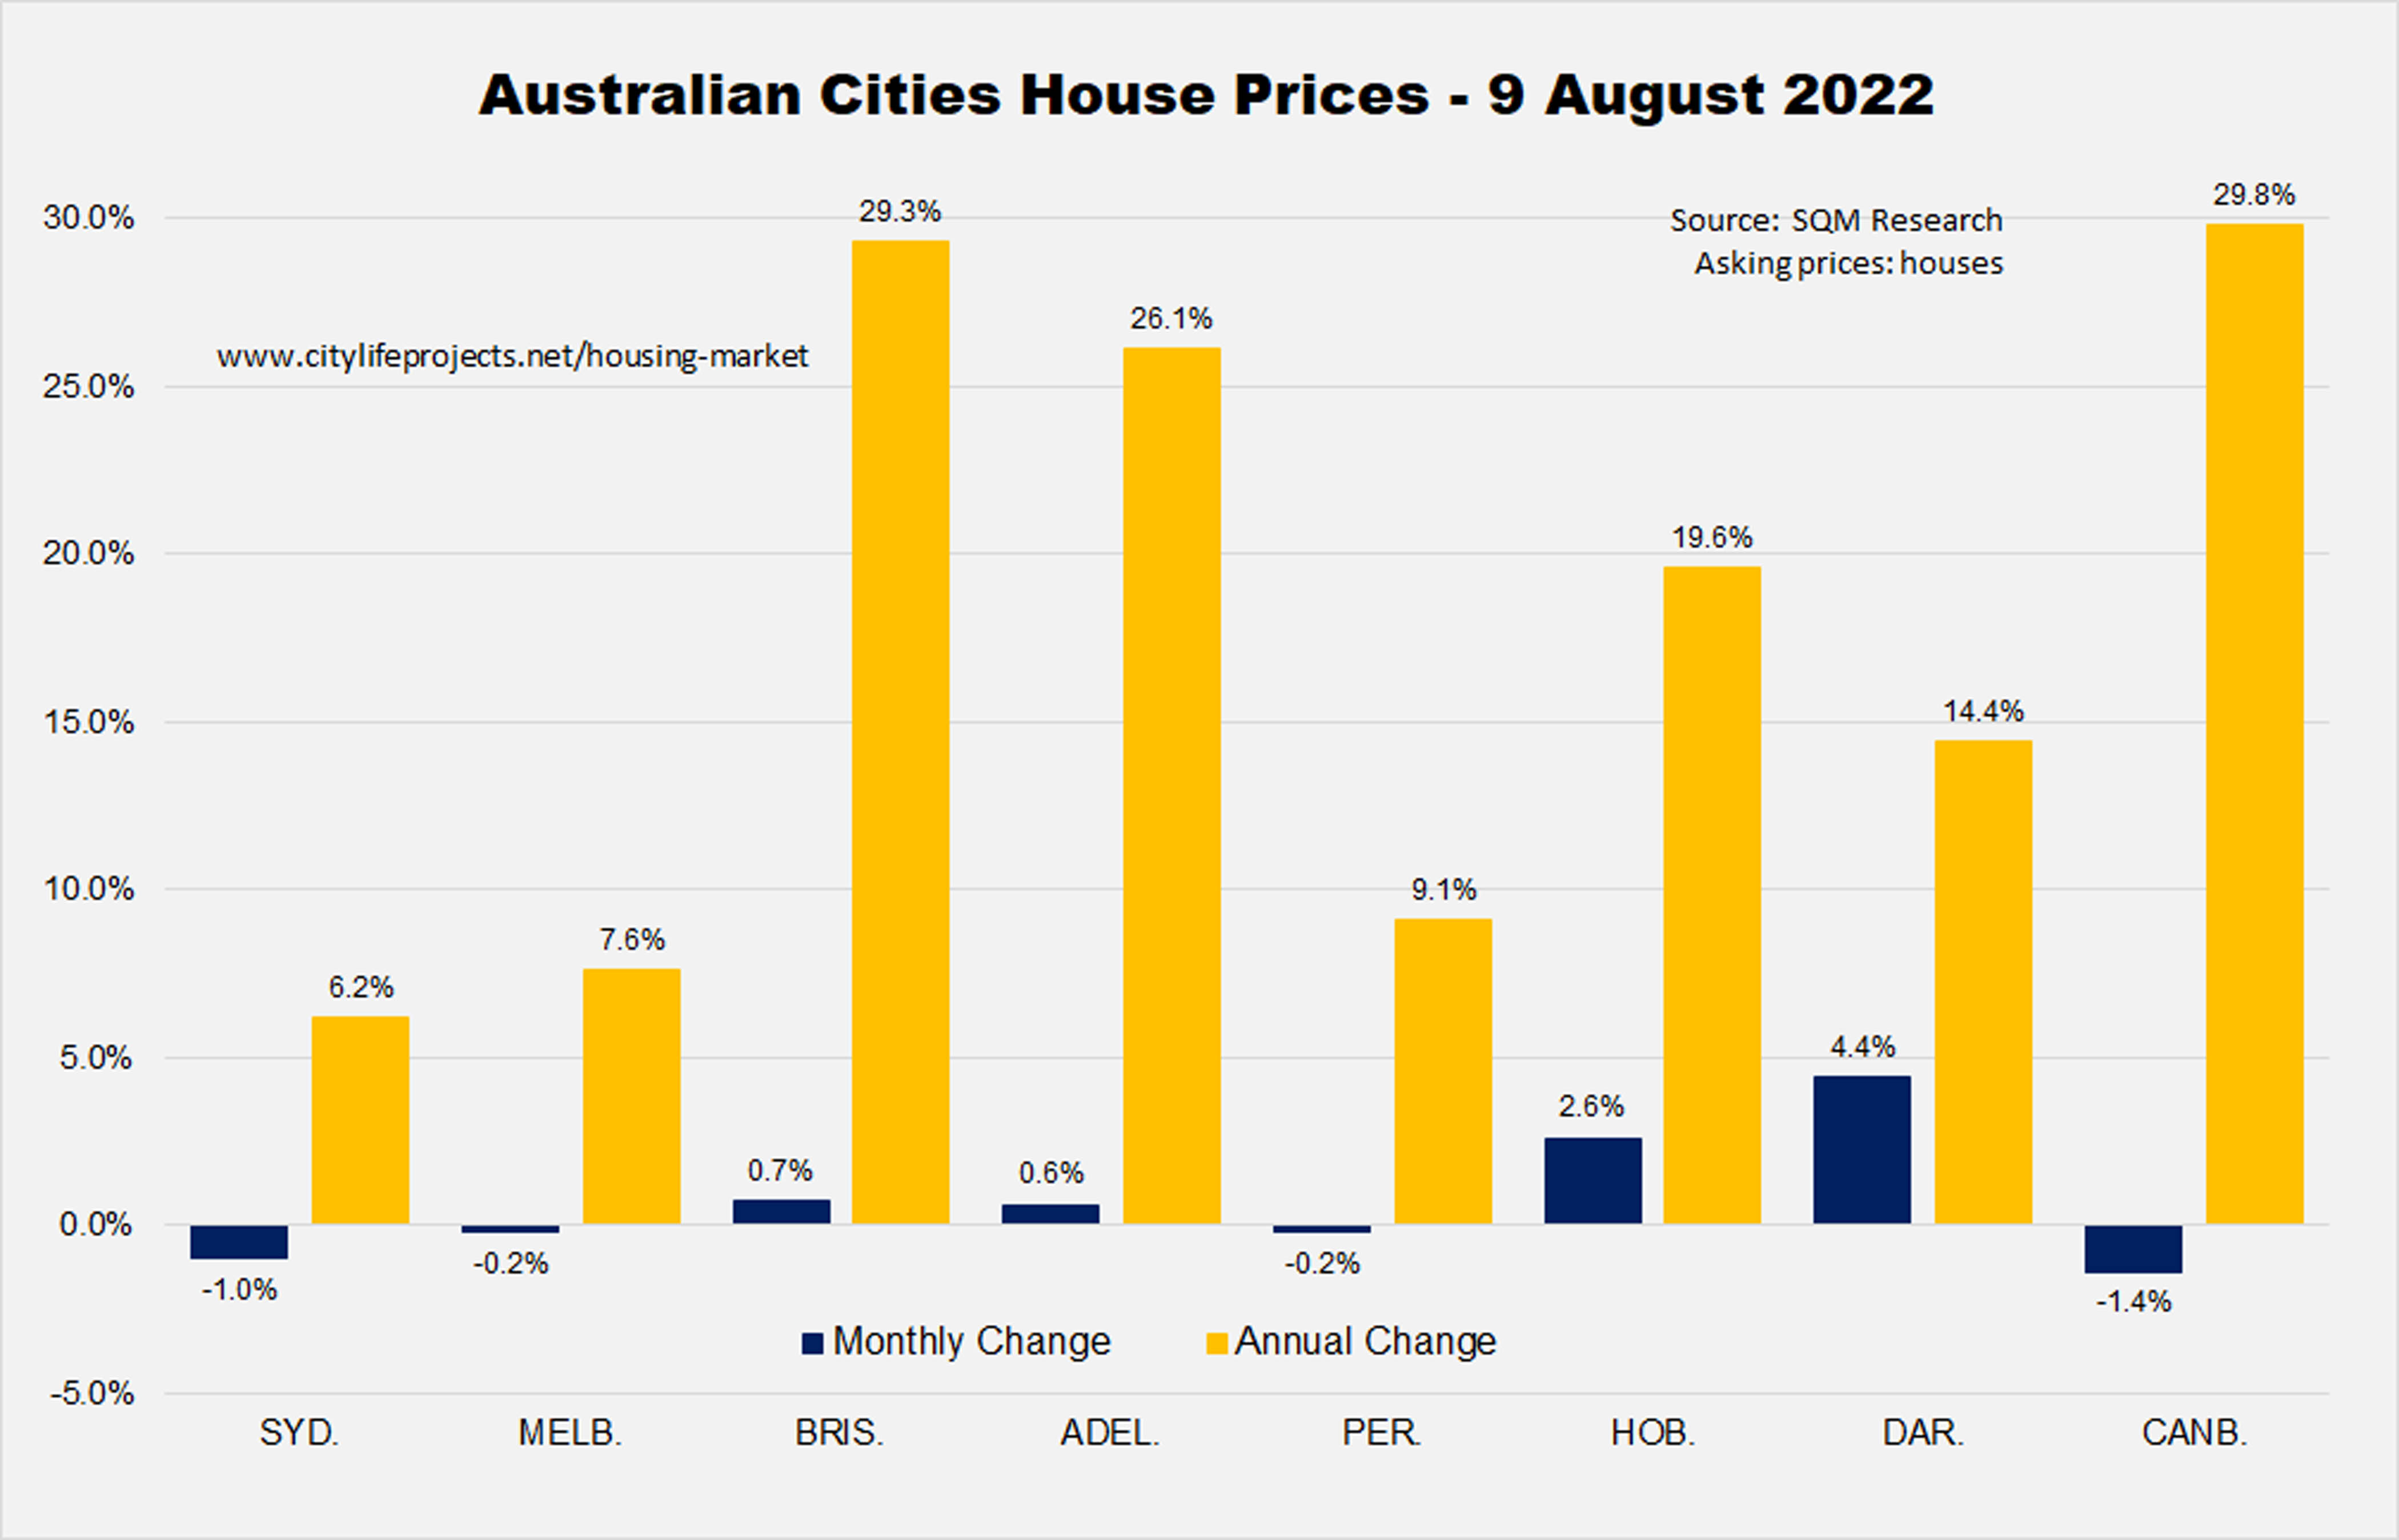
LAST 12 MONTHS IN AUSTRALIA'S HOUSE PRICES***:(updated monthly)
PREVIOUS 12 MONTHLY REPORTS ARE SHOWING BELOW
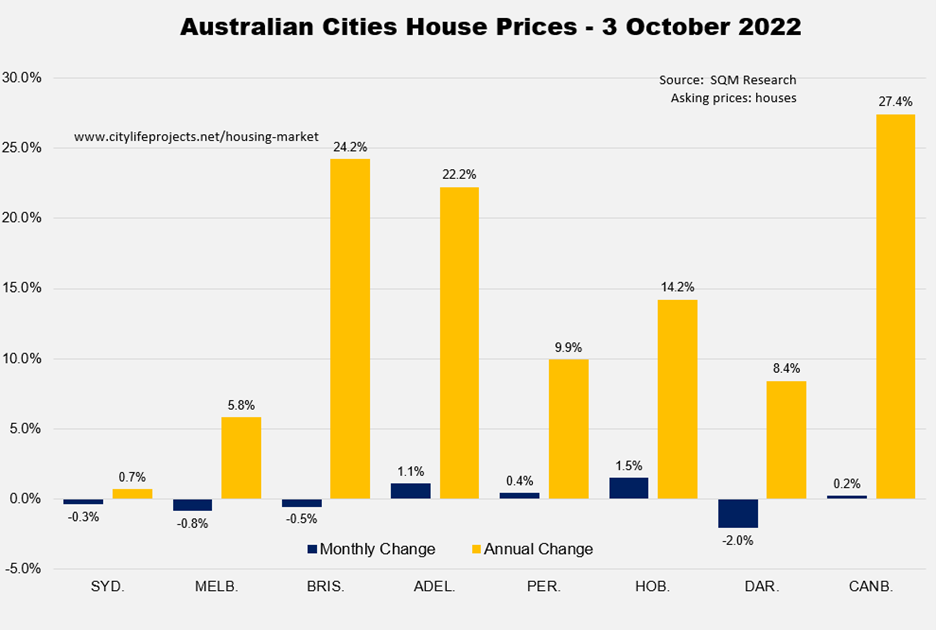
PREVIOUS MONTHS HOUSE PRICES:
* NOTES
1. UPDATED MONTHLY BY CITYLIFE INTERNATIONAL REALTY, AS PUBLISHED BY SQM RESEARCH AUSTRALIAN HOUSE PRICE DATA, RECORDED EVERY TWO WEEKS BASED ON WEEKLY ACTUAL ASKING PRICES.**
2. FIGURES AS SHOWN REFLECT THE PREVIOUS 12 MONTHS CAPITAL GROWTH OR CAPITAL LOSS BASED ON "ALL HOUSES" CRITERIA FOR THE CITY IN QUESTION.
**SQM Methodology Why Asking Prices?
Timeliness - comprehensive data that does not need revision as the sample size is complete. Being able to assess where vendors sit with the market is also very useful.
Do they have the confidence to be lifting their asking prices, or are they keenly dropping their prices in order to get out? In compiling SQM Research’s new market indexes, we have been surprised at how reactive vendors and landlords are to the market. It is clear vendors are very responsive when considering the whole market on aggregate. Indeed, there is some evidence to suggest that they at times, drive the market, especially when it enters into a new upswing.
Base Methodology: After considering all various house price methodologies, SQM Research came to the conclusion that using a stratified methodology based on geography for these new indexes, would be most optimal for the required task. SQM Research declined to use a hedonic model as there was negligible additional accuracy provided compared to the stratified model, which accurately adjusts for compositional bias. All capital city regions and city wide averages were stratified based on splitting postcodes into decile brackets. The decile brackets were calculated based on the relative long term median sold price ranking of each postcode.
SQM Research will monitor and update longer term pricing points and suburb rankings annually and make revisions to the decile bands accordingly. Subsequent revision of the index is expected to be negligible. All compilations of cities are based on the Statistical division of each capital city as measured by the Australian Bureau of Statistics.
Percentage of Listings That Have an Asking Price: 89% of all listings captured have a price indicator. Listings that have an asking price range are included, using the bottom of the price range. Auctions are left out of the calculation unless an asking price is provided after the auction event.
Vendor Discounting and the Effect on the Indexes: Where a vendor has discounted their asking price, it is calculated in the overall aggregate median of asking prices in the index. There are no weightings applied to various asking prices based on age of listing or discounting.


.jpg)